Straight to:


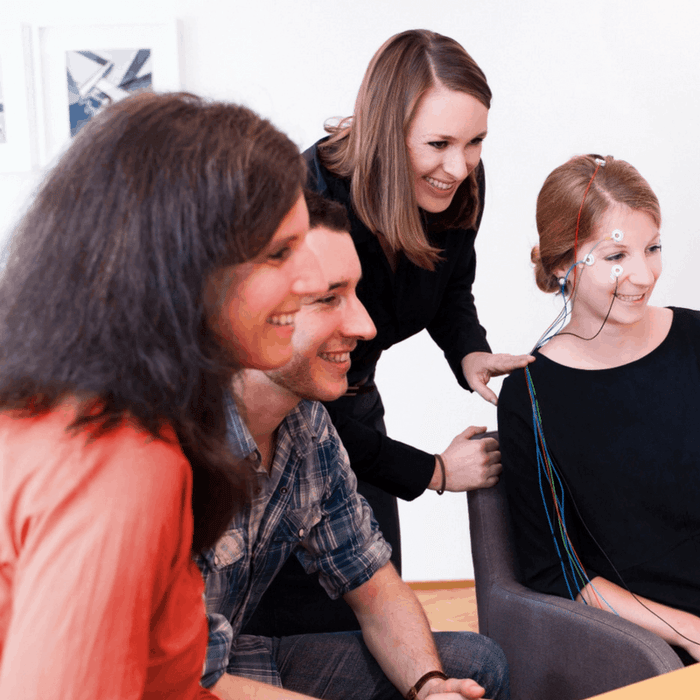
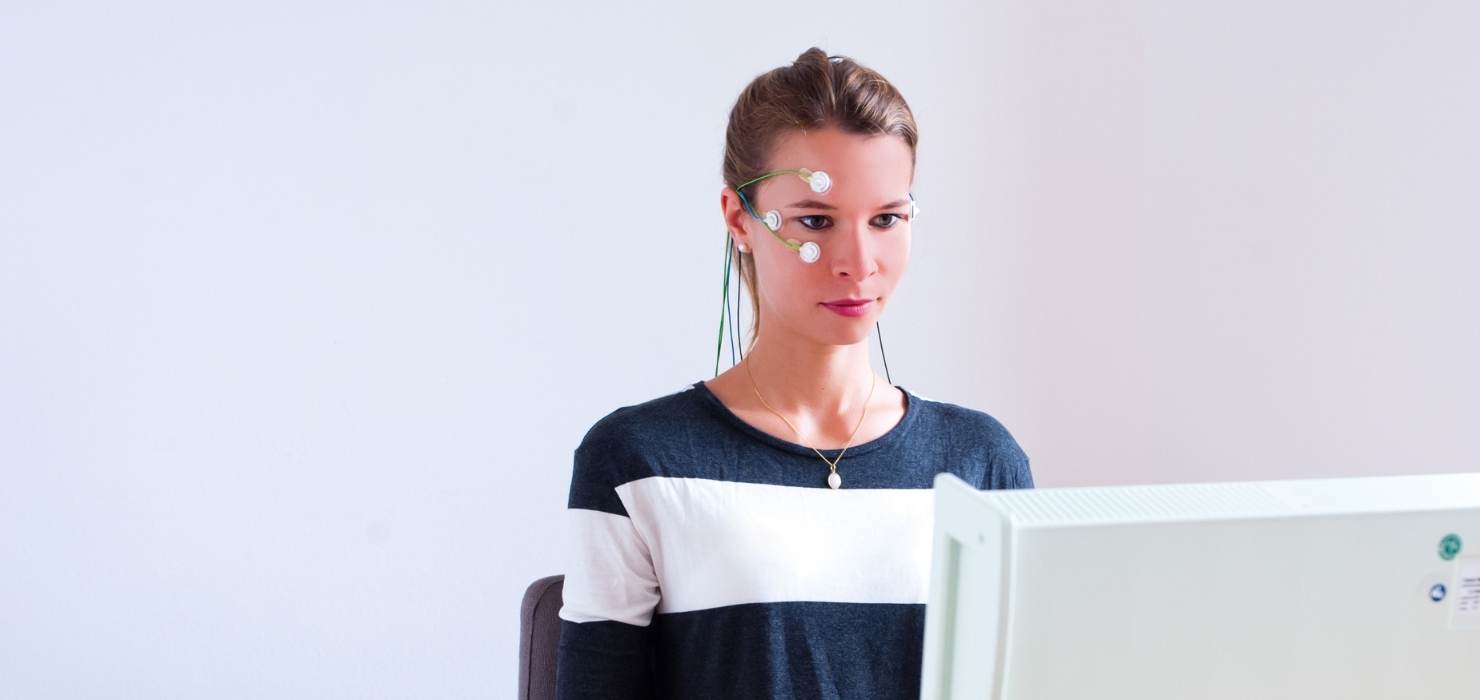
neurocare is a leading provider of Biofeedback and Neurofeedback systems for clinical practice and research. For over two decades we have pioneered Slow Cortical Potentails (SCP) neurofeedback systems with precision artefact control and other EEG devices for best-practice Neurofeedback training for the treatment of ADHD, sleep disorders among other emerging indications.
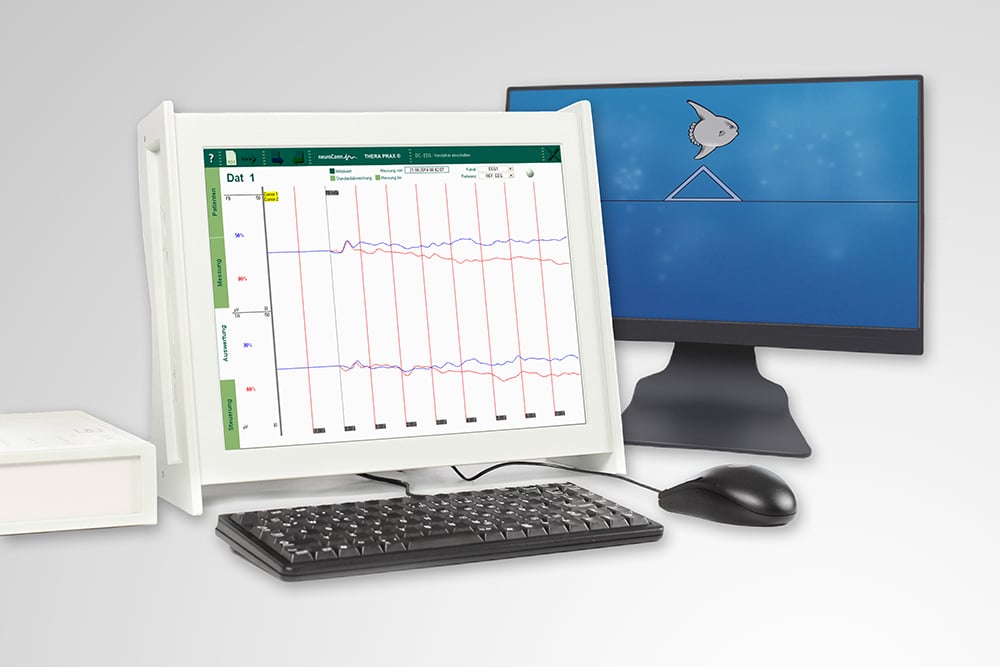
Neurofeedback systems for clinical practice
Made in Germany by neuroConn Technology, the THERA PRAX® MOBILE Neurofeedback system offers advanced artefact control and best-practice delivery of the SCP-Neurofeedback protocol as well as other frequency-band settings and optional biofeedback extensions.
Learn best-practice Neurofeedback with neurocare academy